
Casters use a lot of different information to make predictions and analyze the state of a game of StarCraft 2. One often used stat is supply difference: if player A has 120 supply and player B has 100 supply, we might say that player A has a 20 supply advantage. I wanted to determine how important a supply advantage is by looking a lot of data and seeing what a player’s win percentage is given a certain supply advantage.
Results and Discussion*
You can view the original data at https://docs.google.com/spreadsheet/ccc?key=0AjlUNdJN-kiedFc5QkZxRVRoUHBWNGRCUUVjOGFmVUE&usp=sharing
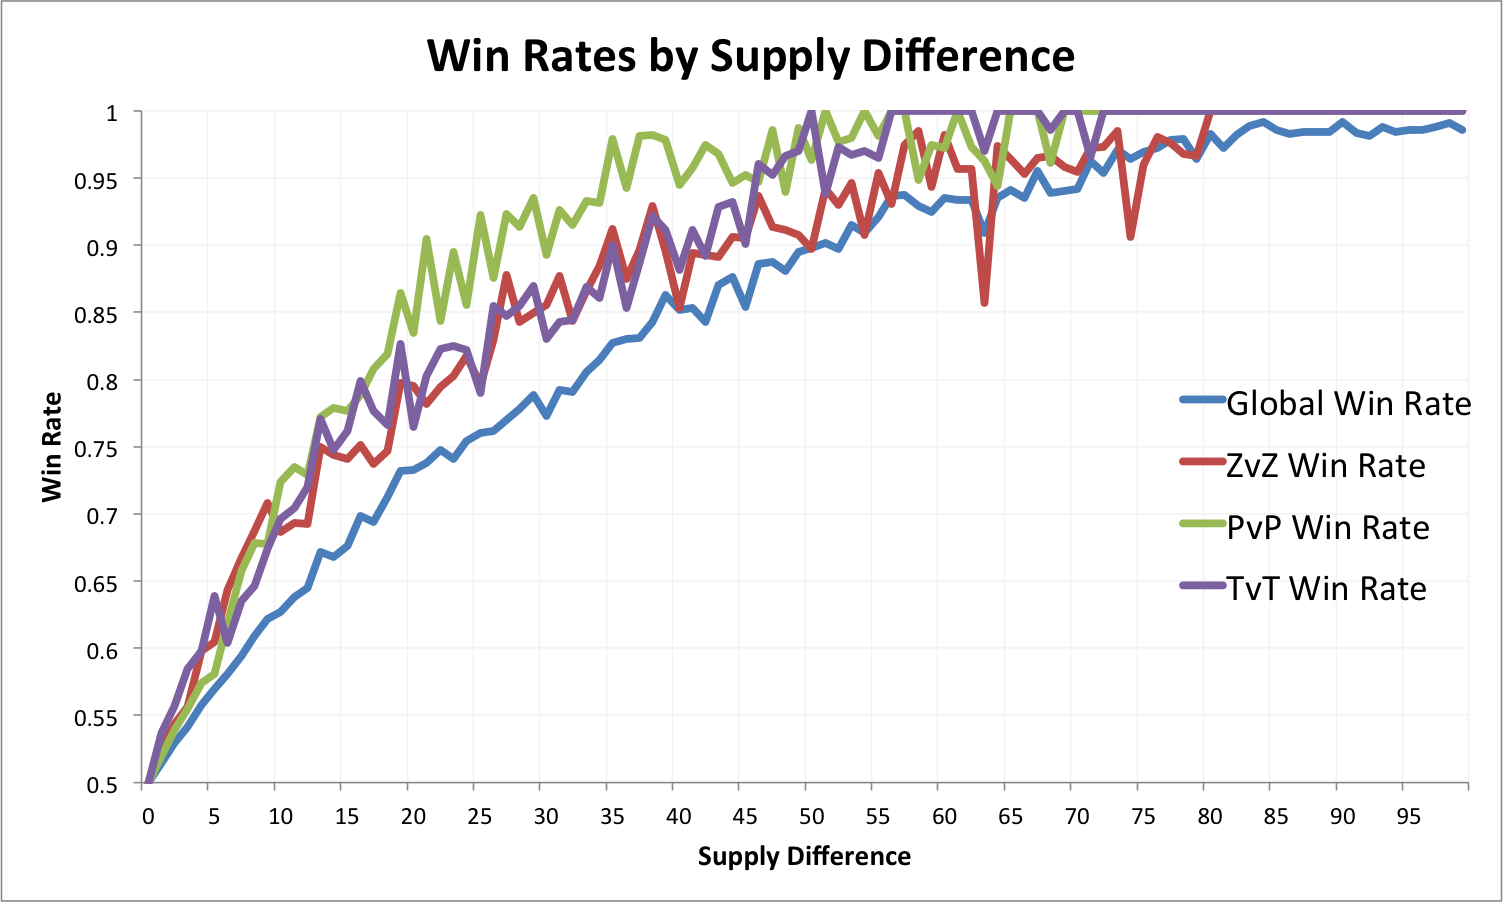
As a rough example, looking at this graph shows that if you have a 10 supply advantage at any point in a game, then you expect to win about 62% of games.
All 3 mirror matchups have higher win rates than globally. For all 3 matchups, being about 15 supply up corresponds to a roughly 75% win percentage (whereas, globally, that’s only about 68%). This seems to make sense since both sides have the same units available, so although your compositions may vary, having more stuff matters more than the difference in quality of units between difference races.
Between the different mirror matchups, the curve for PvP is noticeably higher than the other matchups. This suggests that once you fall significantly (~20 supply) behind your opponent, then your chance of winning drops dramatically. This is less apparent in the other mirror matchups.
Note that supply differences are aggregated from times in the game (see “Methods” below), so more specific conclusions are difficult to draw. I’m happy to narrow in on specific time frames, however, so send along those suggestions!
The important caveat I’ll put out there: of course there’s a lot missing with these numbers. Most quantitative analysis requires qualitative analysis and explanation to be placed into the proper context. Hopefully, however, this data does provide a concrete answer to some things and the premise for new questions.
Future Work
This is just the surface of it! The data is very rich, and I would love to see more results from it. As such, I’m soliciting questions from the community: what queries would you like me to investigate?
The easiest ones for me to do right now are anything involving win percentages by supply difference over different sets of data. For example, we can take a subset of the data and ask, what is the importance of a supply advantage:
- in a given matchup? For example, maybe in PvZ, being at a supply disadvantage doesn’t matter
- on a given map?
- at certain times? For example, a 20 supply advantage at 20:00 might matter a lot less than at 5:00
- with a certain player? Maybe certain players have a reputation for playing well from behind?
- or anything else you’re curious about
Past that, I’m open to any suggestions of things that are best answered by things that one can see in a SC2Replay file and are improved by having a sample of thousands of replays. Send along your questions, and I’ll try to ship back an answer or graph, or at least an explanation for why it’s hard or impossible to do.
Methods
The data comes from approximately 6700 replays from HotS starting around April 2013 to February 2014 available on Spawning Tool. Most replays are from replay packs released by tournaments, but some are from regular members of the community. Only 1v1s that did not result in a tie are counted. There were approximately an additional 1200 replays that were not used because they could not be parsed.
Supply counts are sampled at every 10 seconds in a game.
The data was extracted using the open source project spawningtool. Although the Spawning Tool website database has organized much of this data already, I haven’t quite gotten this data in there, so it takes a little while to run these queries.