
A week and a half ago, I slapped together some graphs about the importance of supply differences and posted it to reddit. There were a ton of very thoughtful comments from the community, some of which I riffed on to create more graphs and investigate more of the data. This post is a summary of the rest of what I found, with all data available in this spreadsheet.
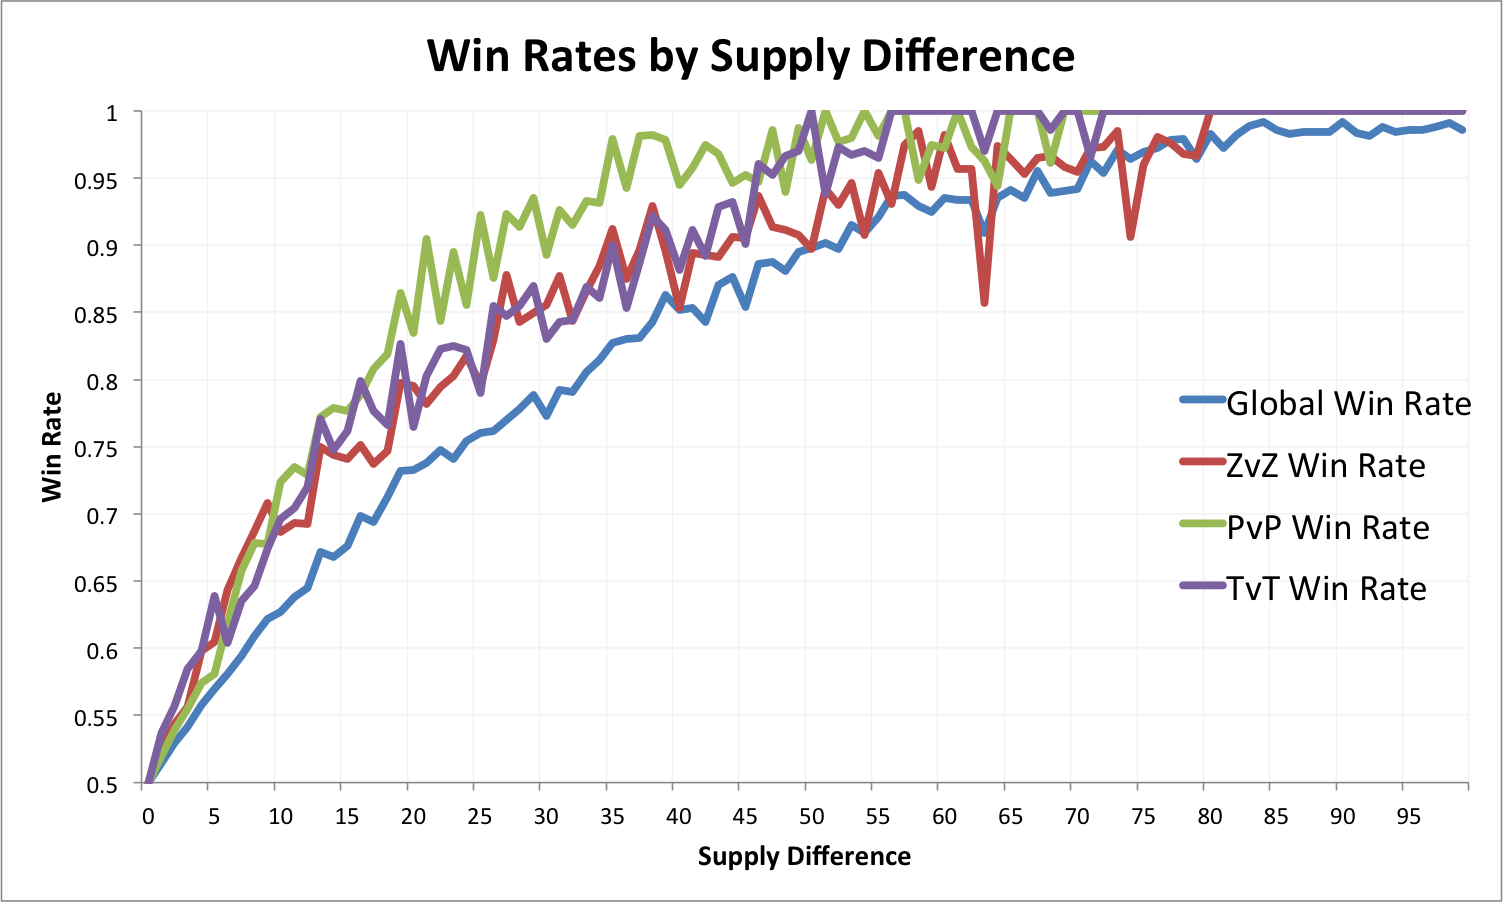
The first graph shows the global win rates and win rates in mirror matchups given certain supplies. The most direct way to use the data is to observe a game and point back to the graph at any time to figure out how much of an edge someone has.
To go a step further, we can compare the different lines to each other. What we notice in all mirrors is that a supply advantage confers a bigger bonus than it does globally. This makes sense: when it’s a non-mirror matchup, you would expect more different compositions, which is another variable that reduces the impact of supply alone. In mirror matchups, however, both players have access to the same units, so since the importance of composition (as well as other differences in playstyles) is diminished.
Finally, the general way I interpret the percentages is that higher percentages with lower supply indicate less volatility in a matchup. If getting ahead in supply a little makes you win a lot more, then there isn’t as much of a chance for a comeback. Looking at the graph above, when PvP gets about 15 supply apart, things snowball way more than other matchups.
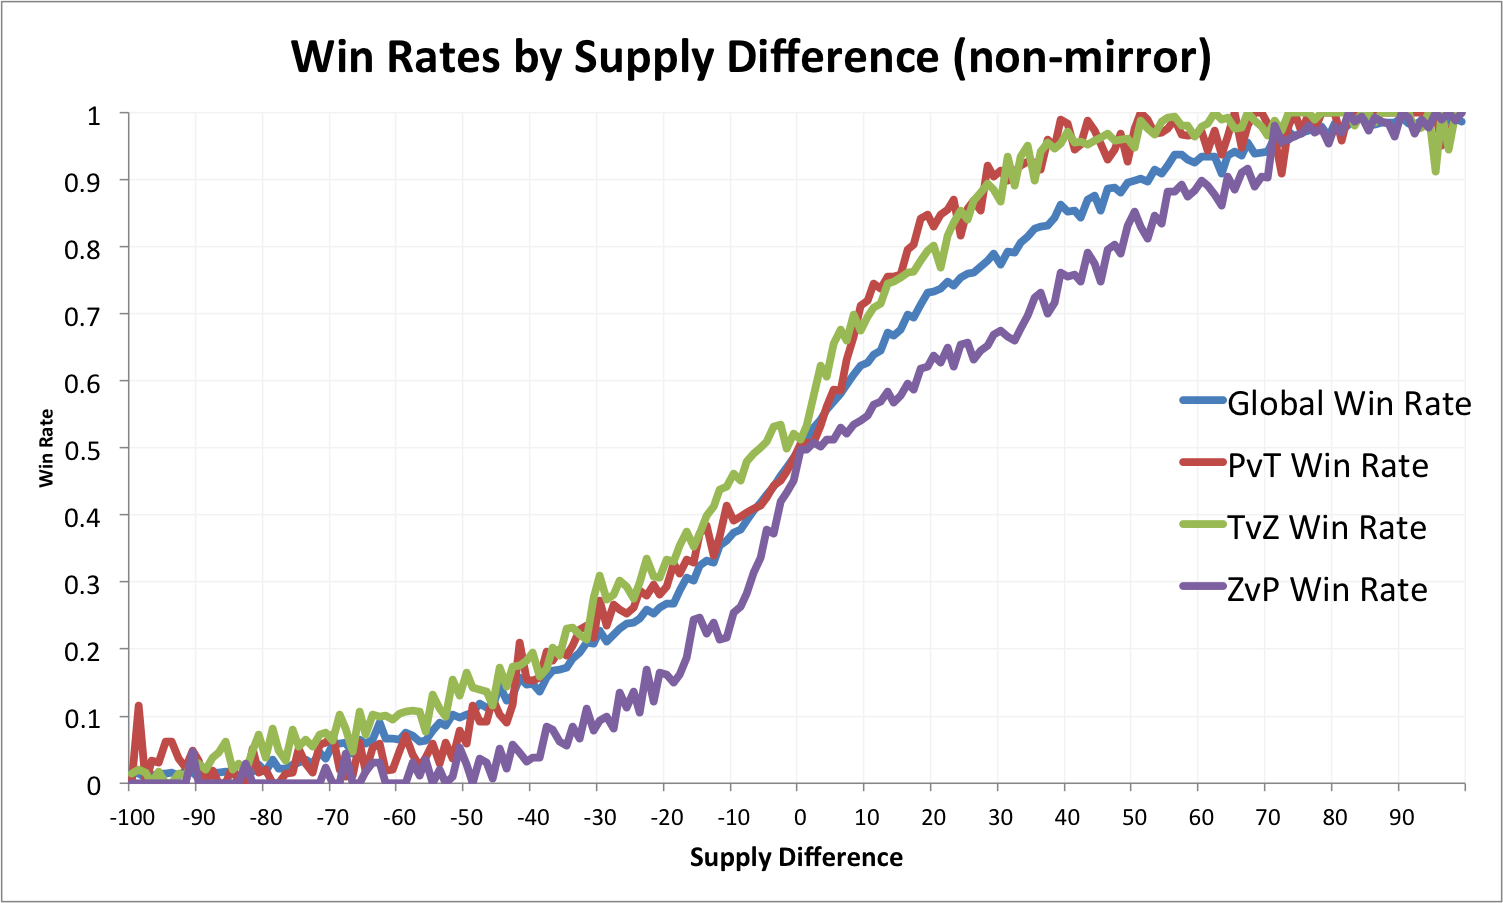 Of course, the next step is to look at non-mirror matchups. In this case, we go both positive and negative since negative PvT is positive TvP. The global win rate, however, should be symmetrical on both sides.
The biggest thing to note here is that ZvP looks crazy. Specifically, Zerg being ahead in supply doesn’t mean much, but Protoss being ahead means a lot. There are a few factors in play here, which I believe are all well-understood. PvT opens with a lot of Fast Expands, which put Protoss behind. In general, Protoss has better, high quality units, whereas Zerg has units like Roaches, which take a lot of supply but are still pretty cheap.
PvT and TvZ look similar to the mirror matchups, but TvP and ZvT are actually both above the global matchup line on the negative side, which means that they (like ZvP) don’t get the same benefit from a supply advantage. I think the argument about quality of units comes into play for both of these matchups as well: Protoss has the best stuff, and Zerg has the cheapest. This is, of course, a gross generalization, and one can certainly go for builds and compositions that run contrary to this. In terms of the value of supply, however, it seems to generally be true from the data.
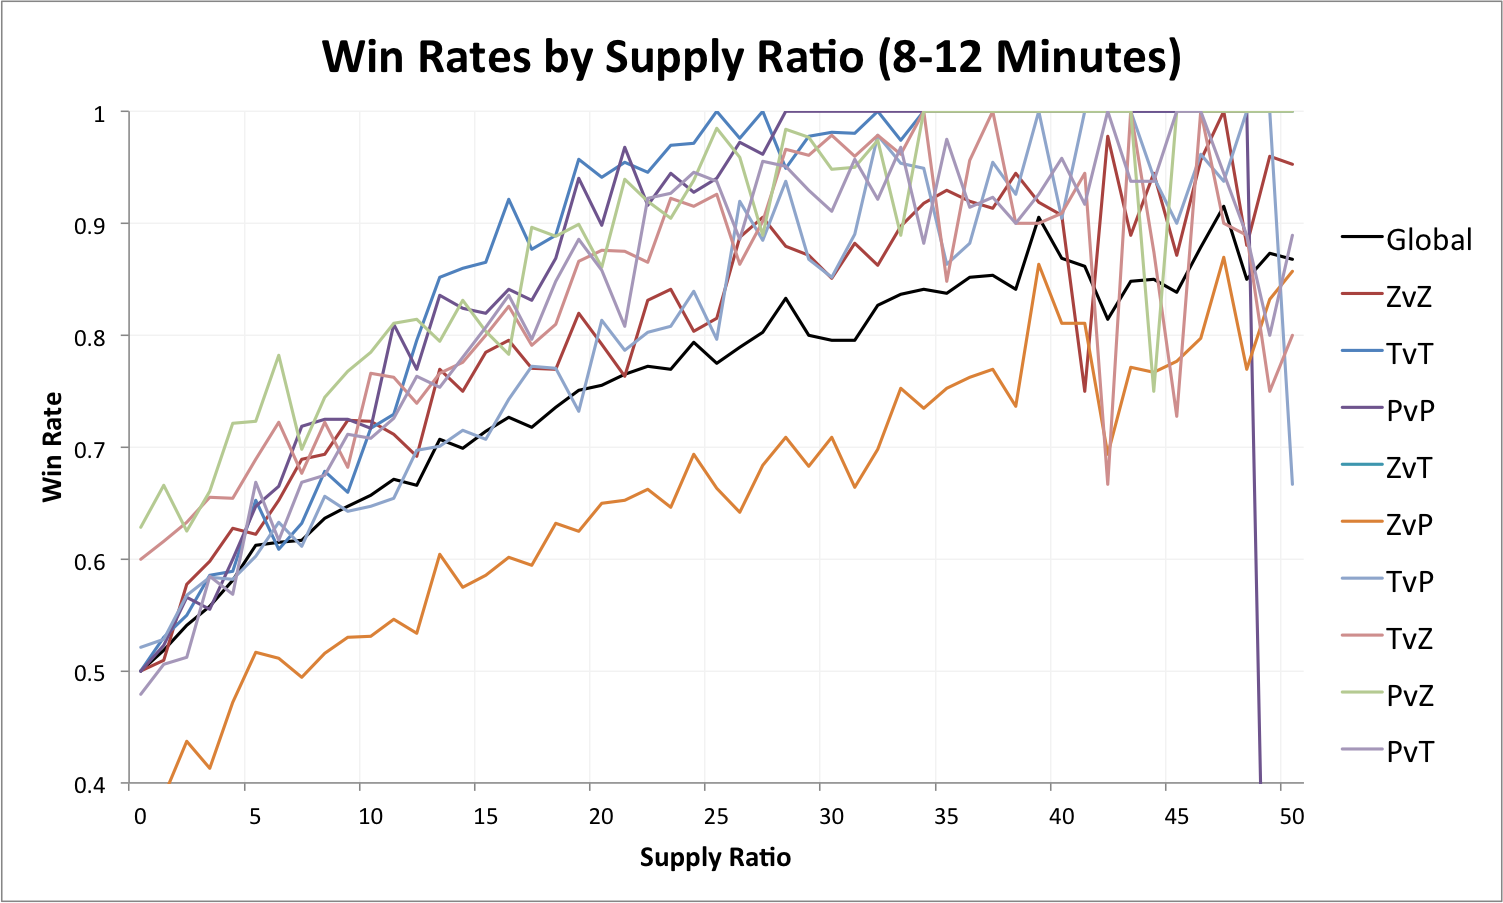
A big flaw with the data presented above is that it collapses data from all times during a game. Feedback was that I should narrow in on particular times, so I picked the midgame. For the graph, I decided to slap everything on the positive side.
The biggest thing to note is ZvP: being even in supply is being behind, it turns out. Given typical strategies from both sides, usually Zerg is ahead on supply with a mass of Roaches to carry through the midgame. Being ahead on supply might not even matter as Immortal-Sentry builds can blunt the impact of that Roach supply. This effect carries all of the way up to to 35-40 supply advantages. PvZ has a nice advantage as well on the flip side.
TvZ also shows an advantage for Terran that isn’t seen in other matchups. I don’t have a particular explanation in mind here.
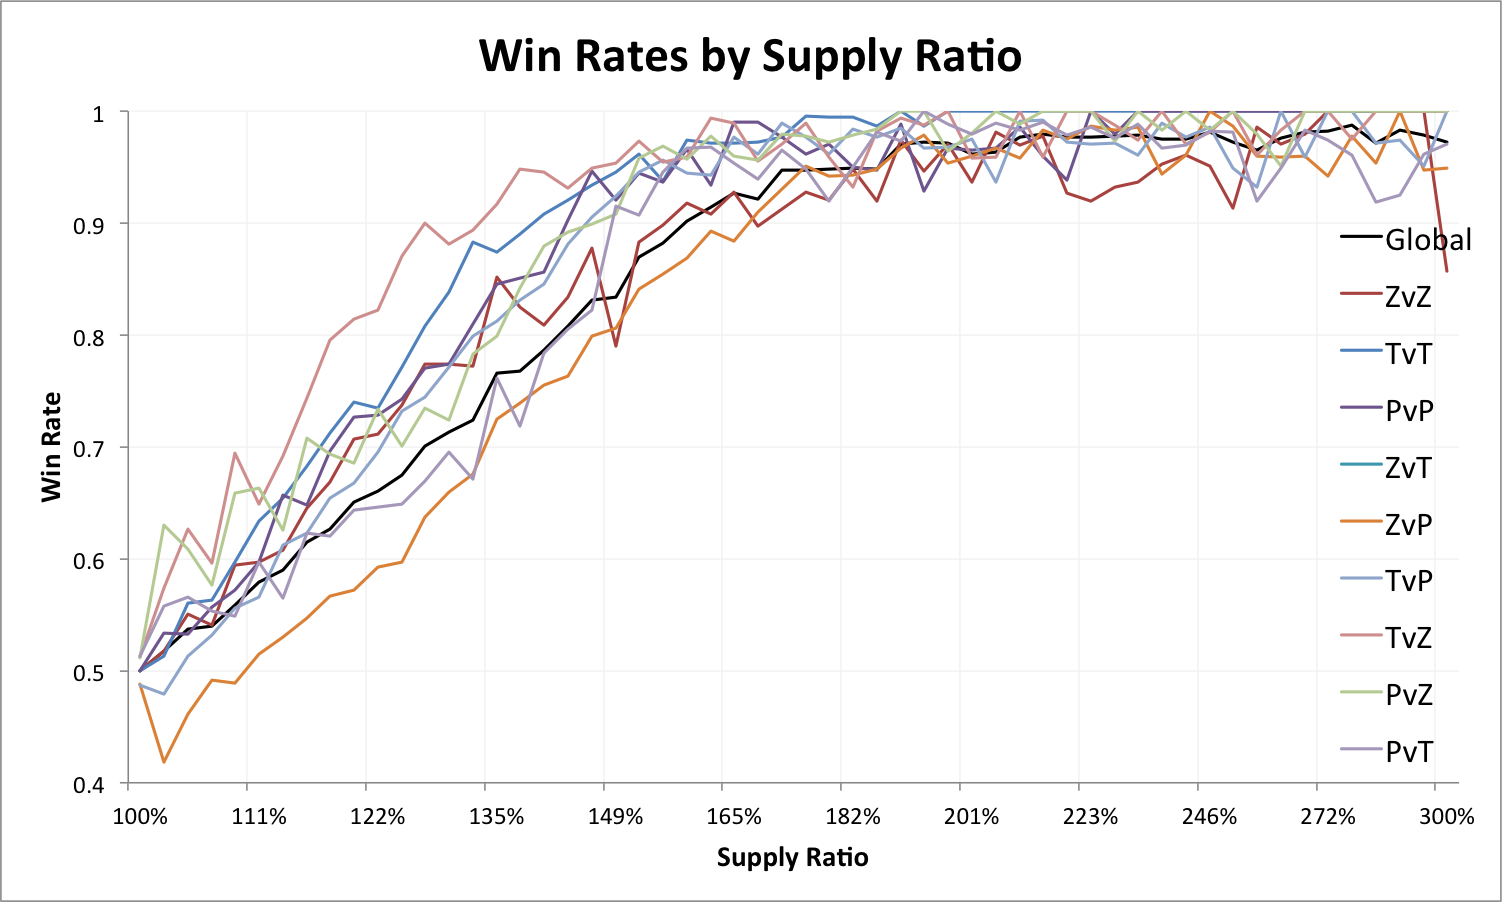
Another suggestion I got was to use supply ratios instead of absolute supplies since being ahead by 5 supply means something very different between 10-15 and 195-200. This is the result from that.
I think the effects here are very similar to what we saw from the last graph, with PvZ, TvZ, and ZvP as the big outliers. Beyond that, I don’t have any particular trends to extract here, though if you’re looking to do in-game prediction, this might be more accurate.
The last thing I did was to divide the data up by minute to try to form a 3D graph. Unfortunately, the surface was quite bumpy, and it ultimately wasn’t as revealing as I would have hoped: as a whole, it slopes roughly as you might guess: being ahead is good, and the later it gets, the less important small supply advantages are.
Anyways, I thought this was a cool use of data, and I hope that I can do more of this in the future. Let me know if you have any ideas on ways to use all of the data in Spawning Tool. I’m happy to brainstorm and take a shot at interesting ideas.
I think the ZvP behavior can be explained due to the difference in strength of Protoss and Zerg units. Protoss units are tougher and deliver more damage on average than Zerg units, this is the Protoss advantage. The Zerg advantage is in the speed of regenerating an army. This difference in relative average unit strength turns the curve on the right into a straight line, and the curve on the left into a steeper exponential.
By using an equation to compute the strength or efficiency of each unit we could take another look at the curves and extract further conclusions from it. I use an efficiency formula for my own analysis, let me know and we could collaborate on something along these lines.
That’s a good point about the relative strength of units. Supply counts miss the quality of units in a given composition. If you have ideas on other ways to model the relationship here, I’m definitely open to further investigation on it.