(Originally posted on reddit and TL)
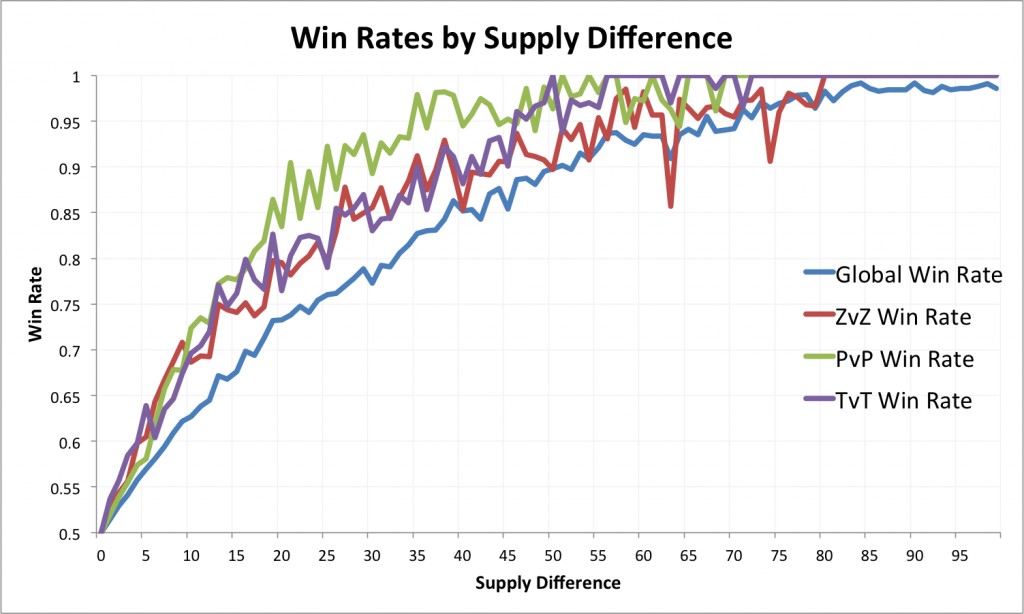
As requested by /u/SidusKnight, here’s the win rates in the non-mirror matchups by game length, which roughly looks at what points in the game certain races appear to have an advantage.
The data comes from roughly 2000-3000 games in each matchup from roughly April 2013 to present on Spawning Tool. The vast majority fo the replays are from tournament replay packs and should represent high-level play, though other games are not filtered out. Note that this does integrate data over multiple balance patches (I’m happy to rerun the numbers within specific time frames upon request).
There aren’t many games shorter than 5 minutes or longer than 31 minutes so the graph is truncated there. On the shorter end, those are ignored since many of them appear to be re-games, and on the longer end, those are grouped together. The raw data is available here.
I’m not really sure how to read the data myself. There are definitely deviations from 50-50 along the way, though it’s heartening to know that it’s pretty close in all matchups in traditional late-game timings (19-25 minutes). It’s a little crazy between 25-31, but that might be small sample sizes. The sample for >31 minutes is pretty big, though, and that is very close for 2 of 3 matchups.
Were I a better person, I would have rendered this online to make the graph slighly more interactive, but as it is, I unfortunately am not. If you would like more interactive visualizations, however, chime back, and I’ll put more effort into that in the future. If you have any other thoughts on other graphs or data you would like to see, I’m happy to take all suggestions for that as well.
Also happy to get help on doing some of this. /u/somedave recommended error bars on the last one, and I actually don’t know what the right methodology and presentation for that is.


