ZvT win rate v. Mutalisk count

(Originally posted on reddit, also posted to the TL thread)

Following the extensive description of the state of Terranin HotS by TheDwf, TL collected opinions from professionals. Specifically, Snute was interested in “the correlation between Mutalisk count and win rate”. Here’s what I came to.

The data comes from approximately 2100 ZvT games from roughly April 2013 to present on Spawning Tool. The vast majority of replays are from tournament replay packs and should represent high-level play, though other games are not filtered out.

The frequency of counts tails off, and I truncated the data around 50ish since past that, there were fewer than 10 games at each point. The raw data is available here

Looking at the data myself, I’m not seeing a lot. There may be a bump around 16 Mutas, but otherwise, it’s hovering around 50% with some variance due to small sample sizes.

Let me know if there are any other analyses, graphs, or stats that you are curious about, and I will do my best to follow up with those.

Close/Cross position win rates (updated for WCS)

A few weeks ago, I wrote a post comparing win rates on cross and close positions 4-player maps. Here’s what it looks like with the WCS replays released by Blizzard yesterday.

(Edit: Fragbite also released their replays, so those are included as well)

PvT PvZ TvZ
Frost
Close Positions 47-39 (54.65%) 49-64 (43.36%) 39-49 (44.32%)
Cross Positions 23-20 (53.49%) 36-25 (59.02%) 15-12 (55.56%)
Total 71-59 (54.62%) 88-92 (48.89%) 55-64 (46.22%)
Alterzim Stronghold
Close Positions 22-17 (56.41%) 29-24 (54.72%) 12-8 (60.00%)
Cross Positions 4-9 (30.77%) 16-10 (61.54%) 5-5 (50.00%)
Total 26-26 (50.00%) 45-34 (56.96%) 17-13 (56.67%)

Methods and Discussion

The replays are mostly from tournament replay packs, with the vast majority being from WCS. Of course, all conclusions must be drawn from what is still a relatively small sample size.

Note that close positions are twice as likely as cross positions. I’m not sure whether that fact is noted as often as it should be.

A confounding factor here is bans. I’m not exactly sure what the effect is, but I’m sure it’s relevant since it’s not a uniformly random sample of potential games.

Frost appears to be far more favorable for Zerg at cross positions. Notably, it crosses over the 50-50 mark depending on the positions. It’s not immediately clear to me whether that advantage is coming early or late, but the game lengths are visible on that page as well if you want to look into that.

Alterzim is less clear, though that PvZ is quite dramatic. It’s a super-small sample size, though, but there may that does or doesn’t confirm common knowledge.

Let me know if there’s any other analyses I have previously done or that you would like to see in the future. The data just got a lot richer and relevant, so hopefully there’s good stuff in there to discover.

Update after a year of extracting build orders from replays

A year ago, I launched Spawning Tool, and it’s grown tremendously in that time. It started out as an experiment in using Blizzard’s replay format to grab build orders. Since then, it has become a site for organizing and labeling replays not only to steal build orders but also to analyze replays in bulk.

So where are we now? By the numbers, Spawning Tool has:

  1. 9,051 replays uploaded
  2. 132,364 replay tags
  3. 23,092 lines of code

I like to hope that Spawning Tool has contributed meaningfully to our understanding and analysis of StarCraft. Highlights are:

  1. Comparing win rates by supply difference (part 1, part 2, reddit)
  2. Putting PvT Blink Stalkers in perspective (blog)
  3. Finding close/cross position win rates (blog, reddit)

I ended up going on hiatus for quite awhile around the beginning of this year, but I have cranked out a few changes recently to highlight as well:

  1. Tags are now directly searchable so you can understand the hierarchy and dig down into specific builds and players
  2. Added spawn positions for players to mark cross and close positions
  3. Started using machine learning to suggest build order tags for replays
  4. Added an easy accept/reject option for rapidly labeling build orders
  5. Drag-and-drop file upload
  6. and lots of other bug fixes, optimizations, and changes

Of course, I have an ask for all of you as well:

  1. Label a few build orders just by accepting or rejecting suggested builds. The archive of replays is as good as its searchability, and build orders still require human expert knowledge
  2. Fill out a survey about your experience with Spawning Tool. I would love to know where to take the site from here

Thanks to everyone in the community for their support. Specifically, I would like to mention GraylinKim (creator of the sc2reader library), dsjoerg (creator of ggtracker), and ChanmanV (host of so many shows) for all of their help in getting Spawning Tool this far. I look forward to seeing what else we can do in the next year!

A better way to add build orders

In my mind, the heart of Spawning Tool is the extracted, readable build orders. To get to that point, however, there are a lot of replays to sort through, and I think that’s where the tagging system becomes valuable. Many of the tags are auto-generated from replay data or extrapolated from past data. The biggest area still requiring human analysis, however, is labeling build orders, which, judging from the front page, hasn’t been well-distributed in the community.

And I admit that the experience so far sucked. You had to find a replay on your own, and it was at least 4 or 5 clicks to punch in a build order. Hopefully, however, it’s a lot easier now with the new system for labeling build orders. There are a few parts to this.

build_order_labeler

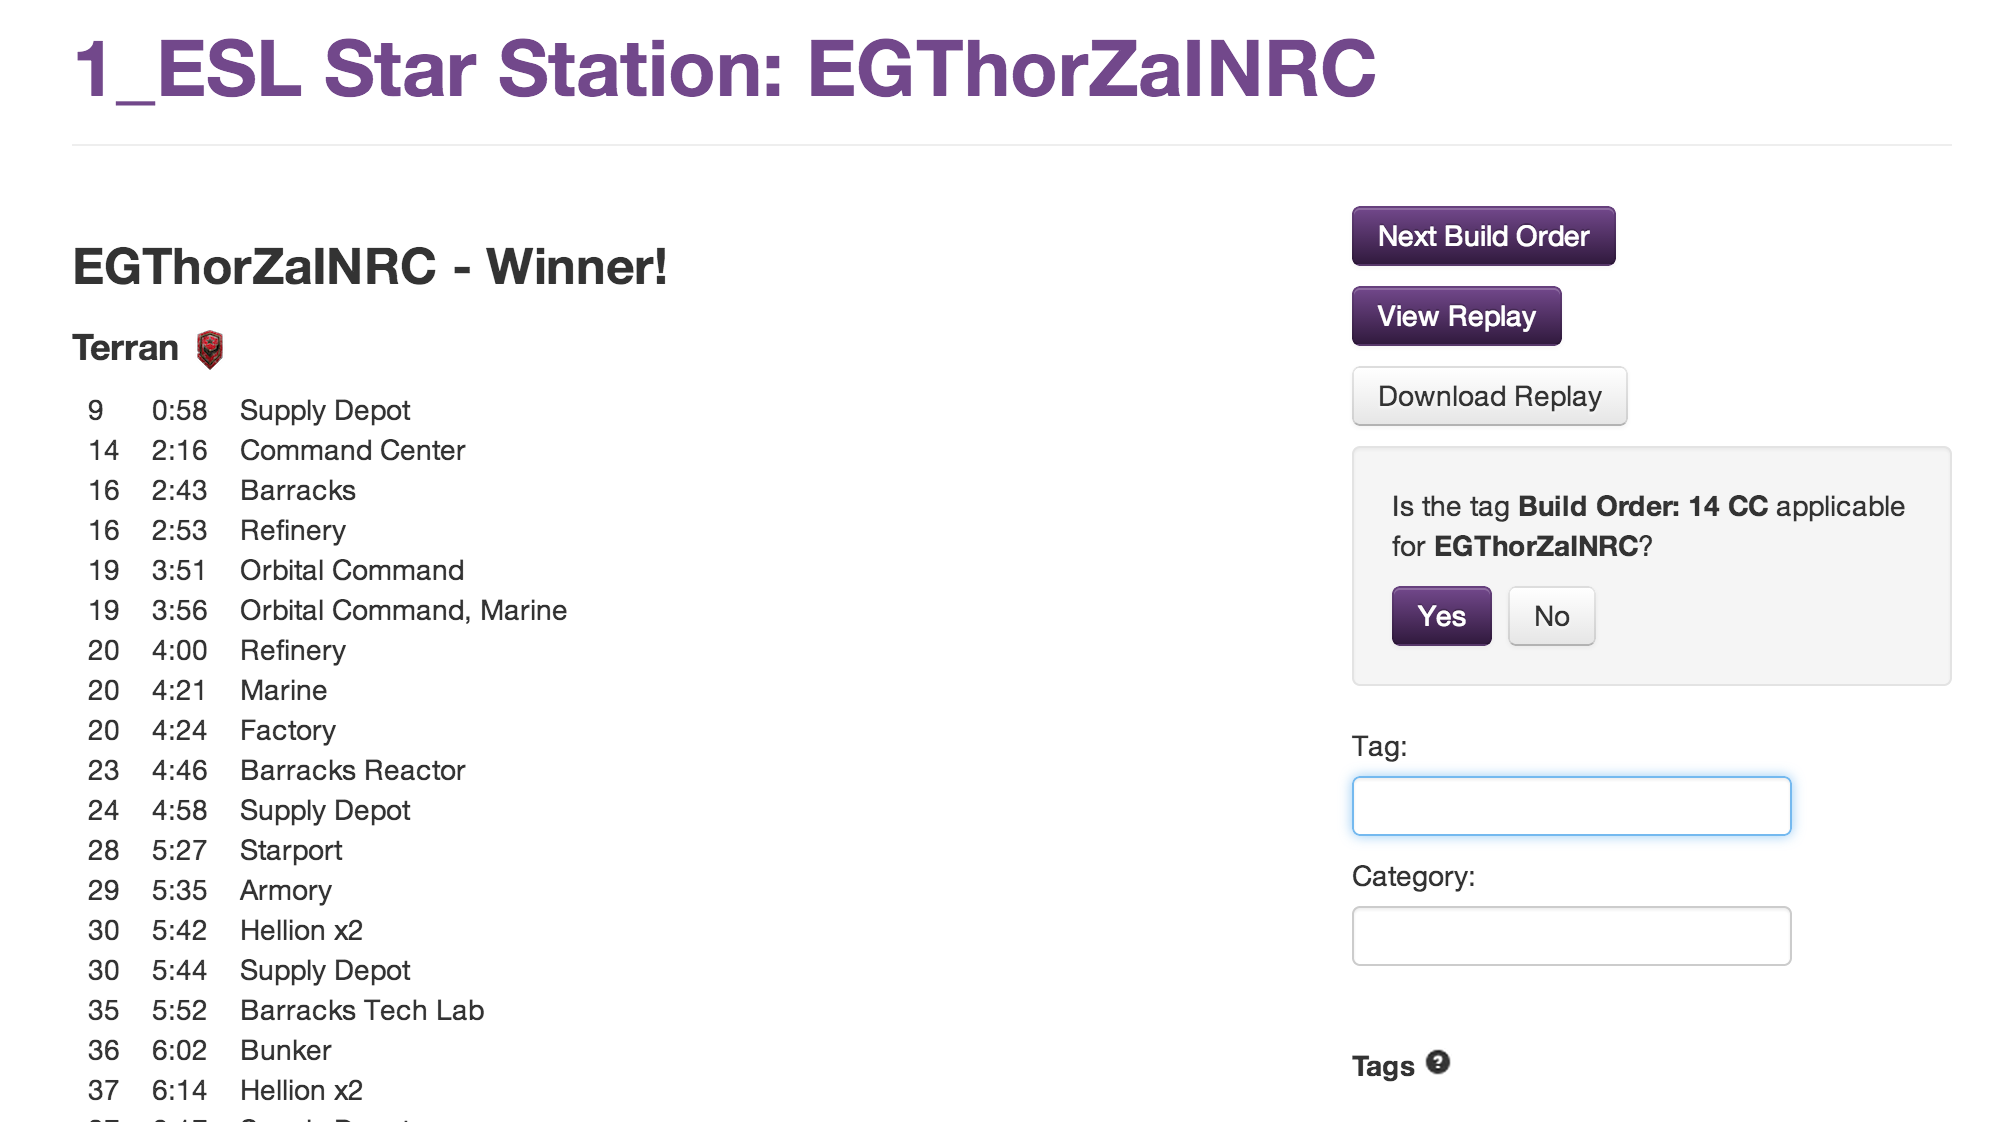
First, you can now approve and reject suggested tags with one click. Previously, it was hard to know what taxonomy of build orders was, and it took too many steps. Now, there are a few thousand procedurally-generated suggested tags for you to approve. You can take a look at the build order and hit “yes” or “no” to determine whether the tag is appropriate or not.

Second, the interface to tag replays is up top on this page. Previously, it was hidden at the bottom of the page on the sidebar and took a click to open up. Now, you’re automatically focused into the box so you can add tags immediately on page load without having to click or scroll anywhere. Hopefully, you can pair up the action of approving or rejecting a suggested tag with more detailed tags on top of that.

Finally, you now see isolated build orders and can browse replay-to-replay. Previously, you had to bounce back and forth from browse (or open 10 tabs at once like me) to tag several replays in a row. In the build order labeling pages, you can jump from random build to build and stay on a roll.

The link to the build order labeler is on the front page, so you can hop straight into that and check out the world of actual in-game builds. Remember to login as well so that your tags are associated with you and counted in the leaderboard.

One more thing: my hope is that labeling build orders can become more and more automatic (though still with some human intervention). Machine learning is in the works and can generate suggestions, but it will only improve with more hand-labeled training data. I’m not sure where the tipping point is, but I’m excited to get to a point where that can take off on its own!

Close/Cross position win rates on different maps

I just posted this on reddit, though it’s reproduced below. If you have any comments, please do so on reddit where you’re likely to get better discussion than you would here!


Often, commentators will mention how certain maps favor certain races. I figured I would take a look at actual win rates to see how true those differences are.

PvT PvZ TvZ
Whirlwind
Close Positions 52-57 (47.71%) 76-75 (50.33%) 52-77 (40.31%)
Cross Positions 25-26 (49.02%) 31-41 (43.06%) 36-39 (48.00%)
Total 81-89 (47.65%) 118-127 (48.16%) 98-123 (44.34%)
Star Station
Close Positions 4-4 (50.00%) 5-5 (50.00%) 6-7 (46.15%)
Cross Positions 36-37 (49.32%) 43-63 (40.57%) 91-70 (56.52%)
Total 43-44 (49.43%) 50-73 (40.65%) 106-82 (56.38%)
Frost
Close Positions 24-18 (57.14%) 29-27 (51.79%) 19-21 (47.50%)
Cross Positions 12-10 (54.55%) 17-11 (60.71%) 7-7 (50.00%)
Total 37-28 (56.92%) 49-41 (54.44%) 27-31 (46.55%)
Alterzim Stronghold
Close Positions 8-9 (47.06%) 17-8 (68.00%) 3-3 (50.00%)
Cross Positions 1-6 (14.29%) 7-2 (77.78%) 3-2 (60.00%)
Total 9-15 (37.50%) 24-10 (70.59%) 6-5 (54.55%)

Methods and Discussion

For each replay, the map is divided into a 3×3 grid, and each cell is assigned a clock position (11, 12, 1, 3, 5, 6, 7, 9). The starting building (CC, Hatch, Nexus) position for each player is recorded. With those, cross positions are all locations that don’t share either a column or row, leaving 3 cross positions for each starting location. For example, 11 is cross from 3, 5, and 6.

The Replays are mostly from released tournament replay packs uploaded to Spawning Tool. Unfortunately, the biggest source of professional games is WCS, and they haven’t released for 2013 season 3 or 2014 season 4 (though I’m excited to redo these numbers after they do!). Because of that, we don’t have as many examples from newer maps.

Maps are collapsed across the different versions (e.g. Frost and Frost LE are counted together). Star Station was changed to a 2 player map at some point, and Alterzim Stronghold is relatively new. For the other maps, close positions are twice as likely as cross positions, so that’s the difference in counts.

A confounding factor here is bans. Since players in tournaments can ban maps that they don’t have favorable matchups in, we have a biased sample on these maps. I don’t really have any thoughts here.

The cross/close position data is available on Spawning Tool (though it does require sticking &tag=1173 or &tag=1172 to work in the research tool), so I welcome you to poke around with the data there to see if you can find anything else. Also let me know if there is anything else you’re interested in that you think can be informed by replay analysis!

Spawning Tool update: UI tweaks

A few weeks ago, I sent out a survey (still open here if you want to fill it out) about how users use Spawning Tool and what they were interested in seeing in future development. Thanks to the feedback there, I have made quite a few changes recently. There are a few big ones I want to talk about in more detail in future posts, but here’s a list of some of the smaller ones.

First, the browse replays page now shows the names of tagged players. This happens to be on of the most important pieces of information to see at a glance, and it doesn’t clutter the interface. I would have liked to do map name as well, but the poor standardization in map names would be messy, and you’re better off using the hierarchy from the tag filters.

Second, I slapped race icons around on the site. One totally valid criticism of Spawning Tool is that it lacks any visuals. I’m not great with either visuals or data visualization, so I largely depend on text and numbers to convey things. I’m open to other suggestions on visuals as well.

Third, I opened up tag pages for all users. I was previously using this just as an administrator tool, but it’s a handy dashboard around a player or build order. Currently, it contains the list of replays tagged and the parents and children of the tag so you can see the hierarchy that exists behind the scenes. I’m a little scared of fleshing out the page too much since generating content is time-consuming and would probably look a lot like liquipedia content, but if you have any ideas on useful things for this page, I’m open to suggestions.

Fourth, there have been various tweaks to the research pages, which were largely inspired by my own annoyances in using them. You can now filter by build orders for each players, and the View Win Rates page has more data to read things off more easily. I think I buffed out the advanced research page as well, but you should consider that “under construction” even still.

Fifth, you can now drag-and-drop .SC2Replay files onto any page (other than the upload page) to instantly upload your replays. A common use case I see for replay sharing is getting feedback from others, and I wanted to make it as painless as possible for someone to share a replay and the build orders.

Those are the minor but not trivial updates. Look for updates soon on other features, and send along any feedback on these or other proposed changes for Spawning Tool.

Stats for WCS AM/EU semifinals

It’s past 3AM here, and over the past 6 hours or so, I have been cranking on a few minor features for Spawning Tool, but primarily machine learning to learn to label build orders. It’s not very well-trained at the moment, but it got to 61% on Reaper Expands, so it was above 50-50. More importantly, the code ran to completion! I’ll write more about that soon.

In the meantime, however, I think I might be sleeping in tomorrow, so I thought I would publish stats before heading to bed. Enjoy the semifinals tomorrow!

MC (P) v jjakji (T)
1. MC beat jjakji 3-1 at IEM Sao Paulo with surprises everywhere. He opened Blink, Phoenix, DTs, and Robo
http://spawningtool.com/research/?p=1&after_time=&before_time=&after_played_on=&before_played_on=&p1-race=&p1-tag=106&p2-race=&p2-tag=475
2. Out of 10 recent TvPs, jjakji went for a Bio Mine composition. Expect to see more of it
http://spawningtool.com/research/?p=1&after_time=&before_time=&after_played_on=1%2F1%2F14&before_played_on=&p1-race=&p1-tag=475&p1-tag=132&p2-race=1&p2-tag=

MMA (T) v San (P)
1. San loves Templar. Before the 25 minute mark, he casts ~2.6x as many Storms as all PvTs, and Ghost usage is also up to compensate
http://spawningtool.com/research/abilities/?after_time=&before_played_on=&p2-race=2&p1-race=&p1-tag=286&before_time=&after_played_on=&p2-tag=&el-after_time=&el-before_time=25
http://spawningtool.com/research/abilities/?after_time=&before_played_on=&p2-race=2&p1-race=1&p1-tag=&before_time=&after_played_on=&p2-tag=&el-after_time=&el-before_time=25

Alicia (P) v HyuN (Z)
1. In 18 games, Alicia has never played a PvZ shorter than 12 minutes.
http://spawningtool.com/research/winrates/?after_time=&before_played_on=&p2-tag=&p1-race=&p1-tag=285&p2-race=3&before_time=&after_played_on=
2. Unlike his ZvT, HyuN doesn’t care how long a ZvP lasts: his win rates are always about the same
http://spawningtool.com/research/winrates/?after_time=&before_played_on=&p2-tag=&p1-race=&p1-tag=82&p2-race=1&before_time=&after_played_on=

Revival (Z) v Oz (P)
1. Oz does a lot of Forge Fast Expands (which are less popular than Nexus First and 1 Gate Expand builds) and at a lot of different timings
http://spawningtool.com/research/tags/?after_time=&before_played_on=&p2-tag=&p1-race=&p1-tag=380&p2-race=3&before_time=&after_played_on=

Stats for WCS AM/EU quarterfinals day 2

I’m a little late here, but here are some numbers:

Snute (Z) v MMA (T)
1. MMA beat Snute in the ATC Season 2 Finals http://spawningtool.com/7773/
2. Snute opened 15 Hatch, 16 Pool in all 10 ZvTs in 2014. However, he has also gone for Roach aggression, Swarm Hosts, and Ultralisks out of it http://spawningtool.com/research/tags/?after_time=&before_played_on=&p2-tag=&p1-race=&p1-tag=58&p2-race=2&before_time=&after_played_on=1%2F1%2F14

San (P) v Welmu (P)
1. I didn’t find much of interest for this matchup. In 2014, though, Welmu has at least 26 San replays to study
http://spawningtool.com/research/?p=1&after_time=&before_time=&after_played_on=1%2F1%2F14&before_played_on=&p1-race=&p1-tag=286&p2-race=1&p2-tag=

Polt (T) v Revival (Z)
1. Revival plays very long ZvTs. 8/11 (73%) went longer than 20 minutes compared to 45% of ZvTs globally
http://spawningtool.com/research/winrates/?after_time=&before_played_on=&p2-tag=&p1-race=&p1-tag=374&p2-race=2&before_time=&after_played_on=
2. Polt also tends to go long, playing 19 / 35 (54%) over 20 minutes. This series could take awhile
http://spawningtool.com/research/winrates/?after_time=&before_played_on=&p2-tag=&p1-race=&p1-tag=57&p2-race=3&before_time=&after_played_on=

Oz (P) v Arthur (P)
There aren’t many replays for these players other than Oz v sOs at IEM Katowice
http://spawningtool.com/research/?p=1&after_time=&before_time=&after_played_on=&before_played_on=&p1-race=&p1-tag=380&p2-race=1&p2-tag=

Stats for WCS AM/EU quarterfinals day 1

Today, the WCS season finals begin for Europe and America. I compiled a few stats that I posted to Team Liquid and are reproduced below.


MC (P) v StarDust (P)
1. StarDust beat MC 2-0 at IEM Cologne. The games lasted 6:56 and 8:38 with MC attacking early in both games (ref)

2. MC is 3-9 (25%) in PvPs lasting 20-25 minutes, but 6-1 (86%) in PvP >25 minutes (ref)

3. MC is diligent in using his Phoenixes. Although he makes slightly fewer (.54 v .65) Phoenixes per game than his opponents, he uses Graviton Beam more often (2.81 v. 1.61) (ref 1) (ref 2)

VortiX (Z) v. jjakji (T)
1. VortiX opened Hatch First in 18/20 (90%) of ZvTs. It’s usually a 15 Hatch followed by a 16 Extractor or Pool. (ref)

2. VortiX is 4-0 in games 8-12 minutes long, all of which were Roach Baneling all-ins. However, he’s only 4-4 in games going Roach Baneling overall (ref)

Alicia (P) v. Bomber (T)
1. Alicia is 19-6 (76%) in games longer than 16 minutes, while only 69% overall. (ref)

2. Don’t play Bomber straight up in TvP. He’s 2-7 in games <16 minutes and 11-4 in games >16 minutes. Blink Stalkers and Dark Templar are good bets (ref 1) (ref 2)

TaeJa (T) v. HyuN (Z)
1. At ASUS ROG Summer 2013, TaeJa beat HyuN 3-2 (ref)

2. HyuN can be deadly in the early game. He’s 9-0 before 12 minutes and 13-2 before 16 minutes (ref)

Methodology
I used the data from Spawning Tool to generate all of these statistics. Notably, replays for WCS 2013 season 3 and the current WCS season have not been released, so those are not included in the current sample. Some players have more data from other recent tournaments, whereas others may be based on older data with different play styles.

If you get chance, please poke around with the data on Spawning Tool and share any other interesting trends you find!

IEM Katowice PvT Blink: 64%. PvT Overall: 61%, a game theoretic analysis

2 weeks ago, IEM Katowice showed off some sick games. My favorite was sOs’s Phoenix into Colossi into Carriers on Alterzim Stronghold, but the biggest news apparently was Blink Stalkers in PvT. After several crushing games by HerO and sOs, it really looked like Blink was imbalanced in this matchup. The most insightful analysis I saw was from bwindley, and now I have had a chance to label data and crunch numbers, here’s my take on the situation with a few numbers, a little analysis, and some game theory.

The easiest point to make here is the raw win rates. In 33 PvTs, Protoss went Blink Stalkers in 11 of them. The overall PvT win rate was 20-13 for 61% (ref). In games where Protoss went Blink, the win rate was 7-4 for 64% (ref).

For comparison, in Spawning Tool, the overall PvT win rate is 804-767 for 51% (ref). In games where Protoss researched Blink before 6:00, the win rate is 71-58 for 55% (ref).

So Blink wins slightly more than normal, but it’s pretty dang close. One would hope that different strategies would have different win rates, or else the meta-game had stagnated as no strategy would confer an advantage over any other (more on this below). Continue reading